Analytics
Power BI Dashboards
Power BI Dashboards
A Power BI dashboard is a powerful decision-making tool that enables intuitive data mining and dynamic visualization of management metrics and KPIs relevant to the organization. It is thus easier to understand the context of a business problem, to assess the need to take action or for further analysis.
The ability to quickly visualize and track management information is a key success factor in executing the strategic plan of any modern organization.


Save time and money! Call on the expertise of our specialists and we’ll make you a functional and well-organized Power BI dashboard in no time:
- Easy to use (super intuitive) and following the rules of the art with the right types of visualizations
- On the cutting edge of the latest Power BI updates
- Can use multiple data sources
- Powerful
- Safe
Our services
Faction A offers you different options for creating and deploying Power BI dashboards in your organization:
PROJECT MODE
Creating dashboards often requires building a modern and complete decision-making environment. Project mode is most valuable when you need an analytics program for enterprise-wide deployment.
NEEDS FULFILLED INCLUDE:
- Fast delivery of tangible results iteratively and incrementally by the Faction A team
- The creation of professional dashboards
- Architecture and data modeling
- Implementation data structures as needed
- Automated and controlled supply of multiple data sources
- Implementation of access security
- Dashboard sharing internally or externally
EXPRESS DASHBOARD
We build for you an example of a dashboard that allows you to visualize your own data, feed your thinking and validate your decision, and answer all your questions about Power BI. All that inexpensively.
HOW IT WORKS:
- You give us a sample of your data in Excel format.
- A one-hour telephone meeting is held so that we can understand what you would like to see as an example and ask you questions about the data.
- We develop a functional dashboard example from your data in a single day. Which gives you a good overview of the possibilities of Power BI.
- We then go to your office and show you the result and, for a couple of hours, answer all your questions about Power BI.
- We then send you the functional dashboard example.
ACCOMPANIMENT MODE
When our customers benefit from an IT team or BI specialists who partly master an analytical environment, a simple accompaniment intervention can be enough to carry out the implementation of dashboards.
THIS APPROACH ENABLES THE:
- Evaluation of the informational environment
- Assessment of the necessary expertise
- Interventions planning
- Evaluation of a support schedule
- Recommendations on the right ways of doing things inspired by best practices
- Integration of resources within your team.
PROOF OF CONCEPT
Our Proof of Concept approach allows you to quickly experience the production cycle of a dashboard according to your needs. This approach allows to:
THIS APPROACH ALLOWS TO:
- Start a comprehensive analytical program with an iteration providing a high return on investment;
- Establish a starting point for the deployment of departmental and enterprise-level analysis;
- Solve immediate business problems without waiting for an enterprise-wide deployment taking months or even years;
- Understand deployment aspects through measurable calibration of a first implementation
DASHBOARD IN A DAY WORKSHOP
We go to your office to help your team learn how to create reports and functional dashboards using Power BI Desktop. This workshop will help you understand how to analyze your data to extract the most out of it.
FOLLOWING THE WORKSHOP, PARTICIPANTS WILL BETTER UNDERSTAND HOW TO:
- Access data from various sources, import and transform them;
- Define administrative rules and key performance indicators;
- Explore data with powerful visualization tools;
- Create beautiful reports;
- Share their dashboards with members of their team or anyone else.
Deliverables
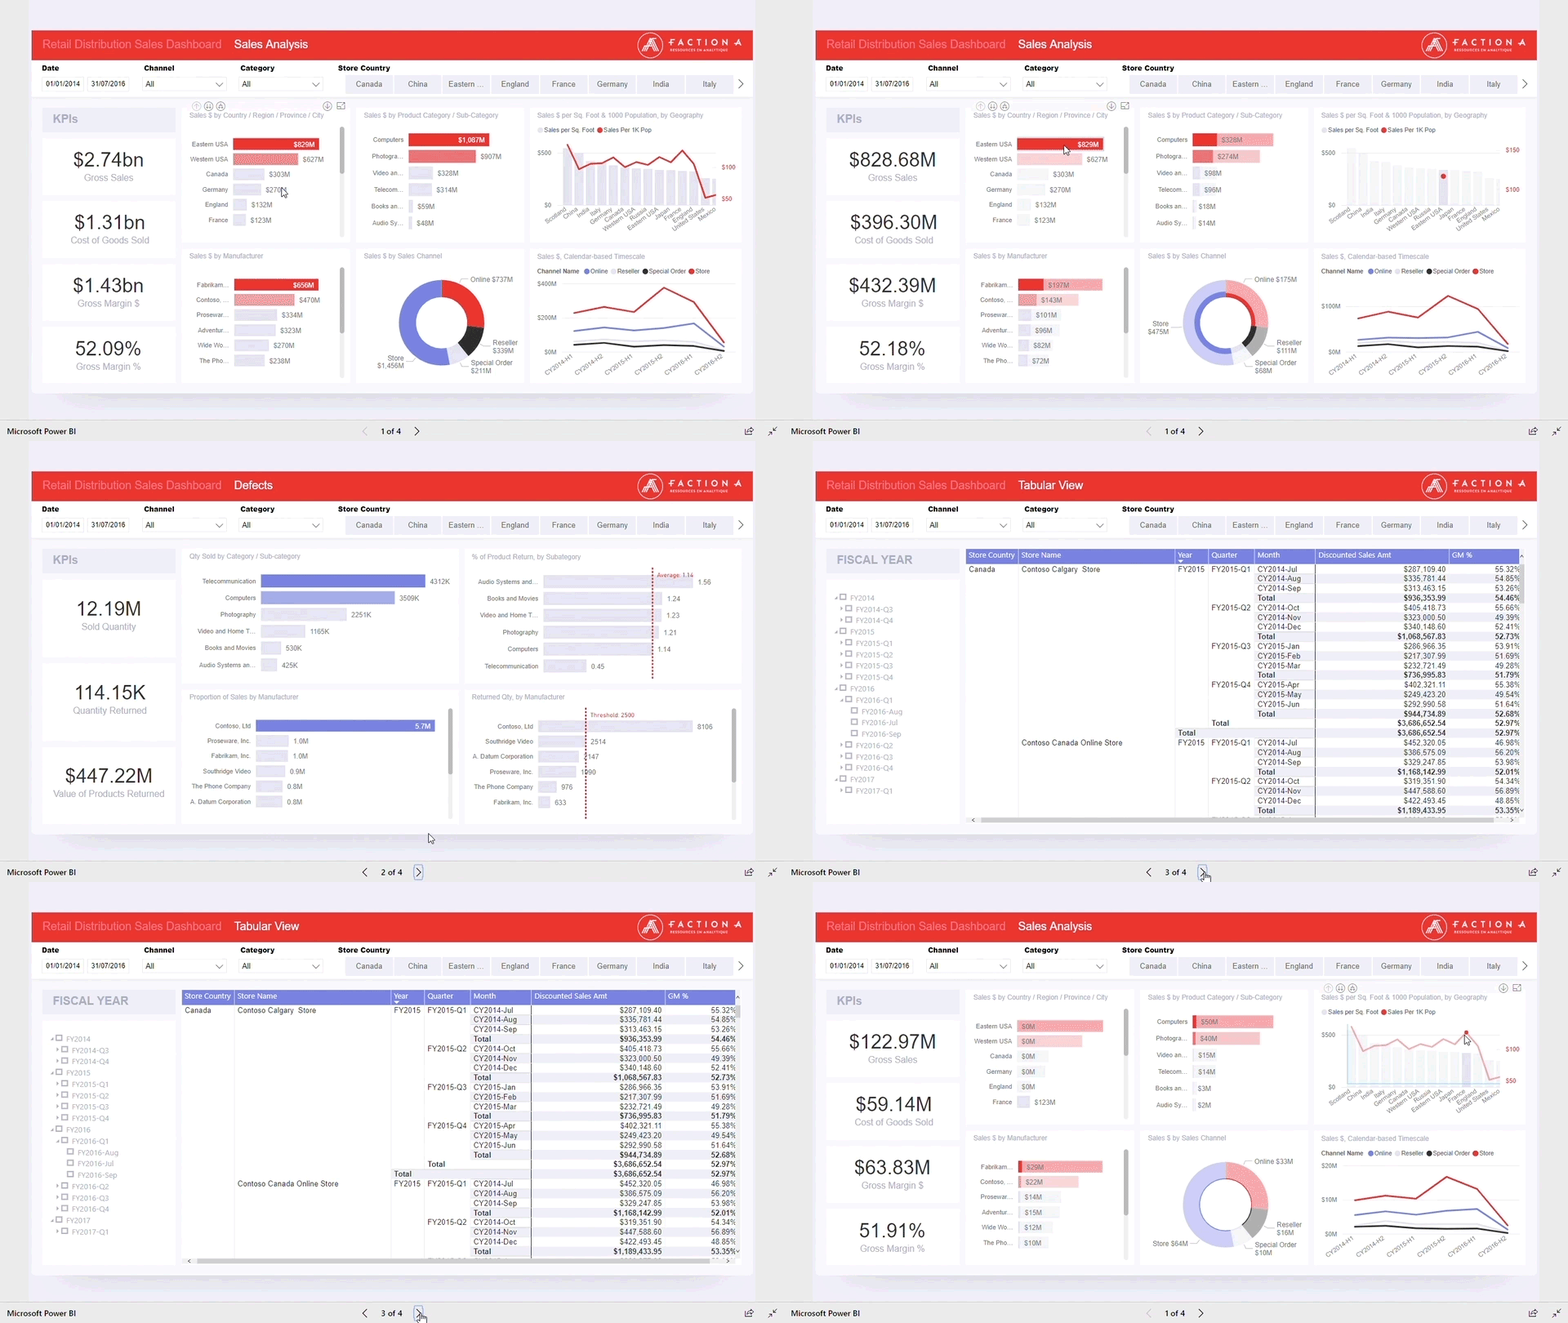
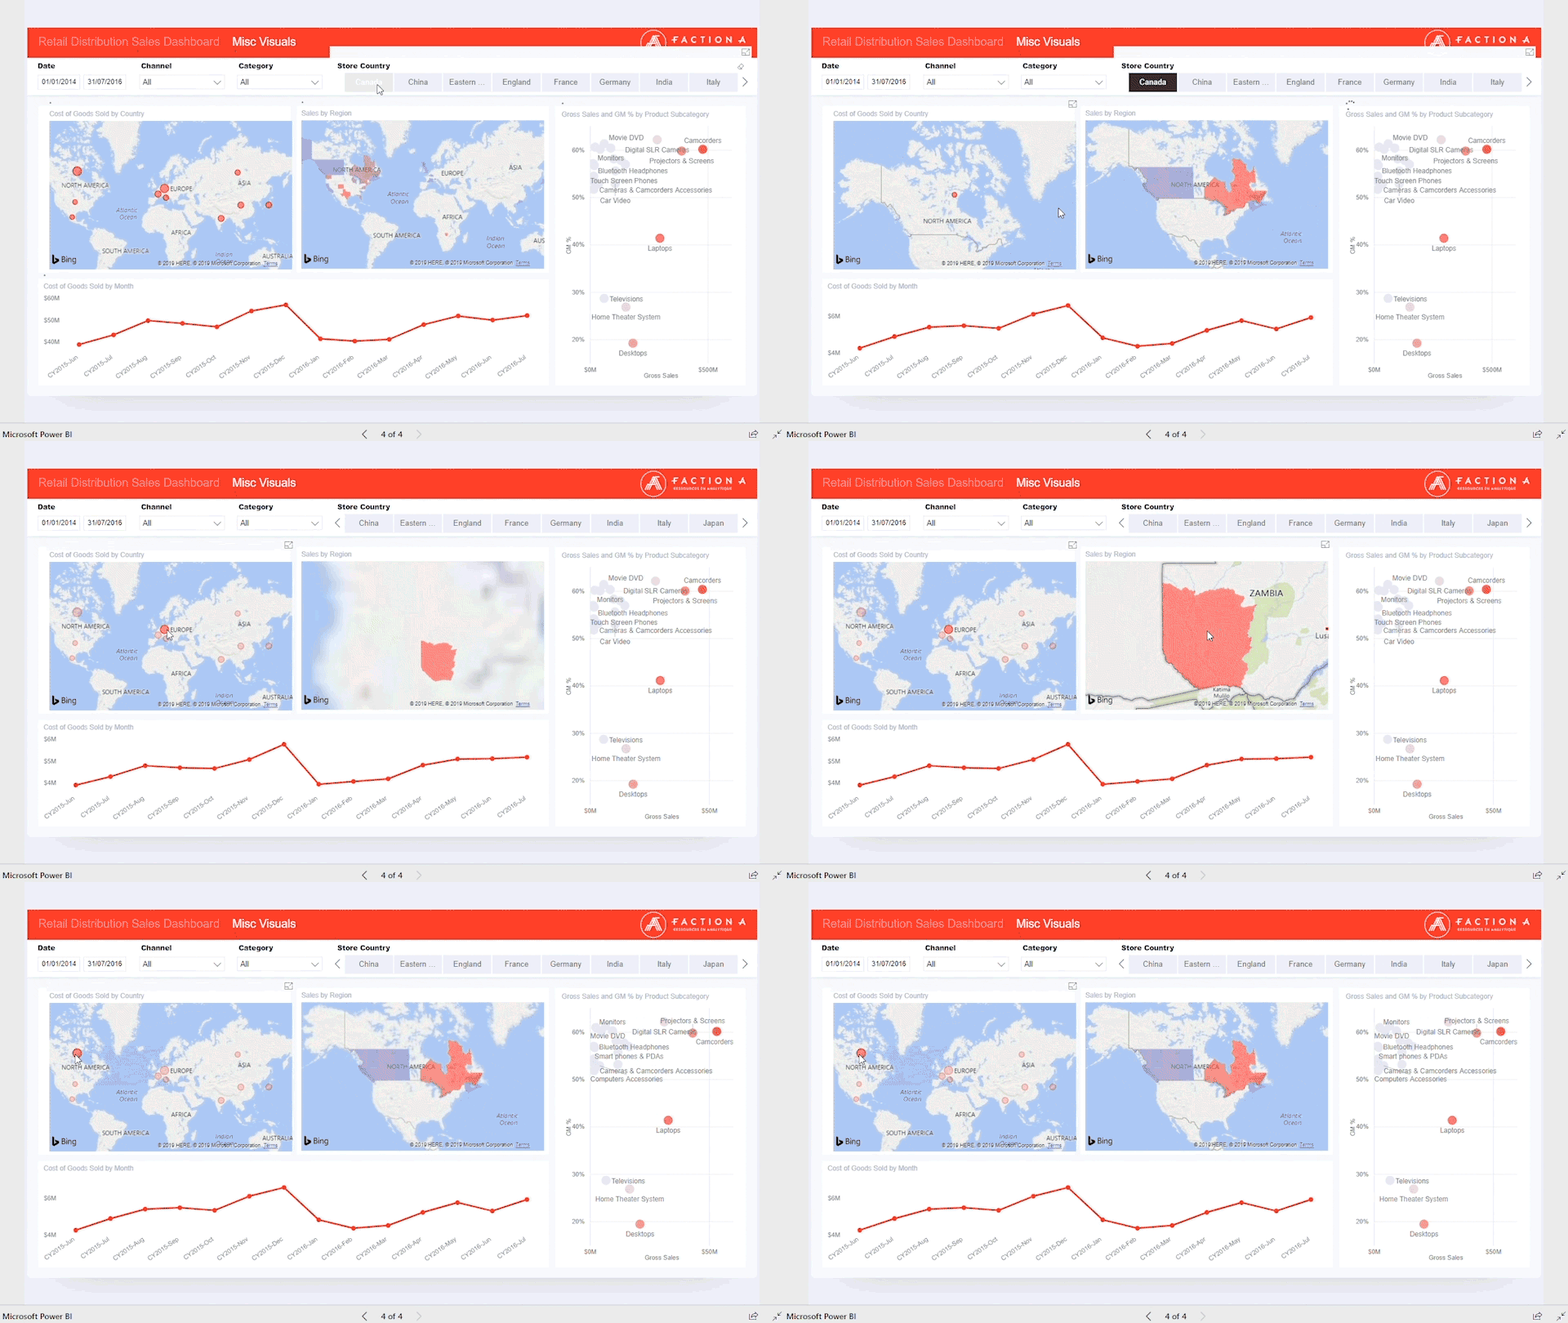
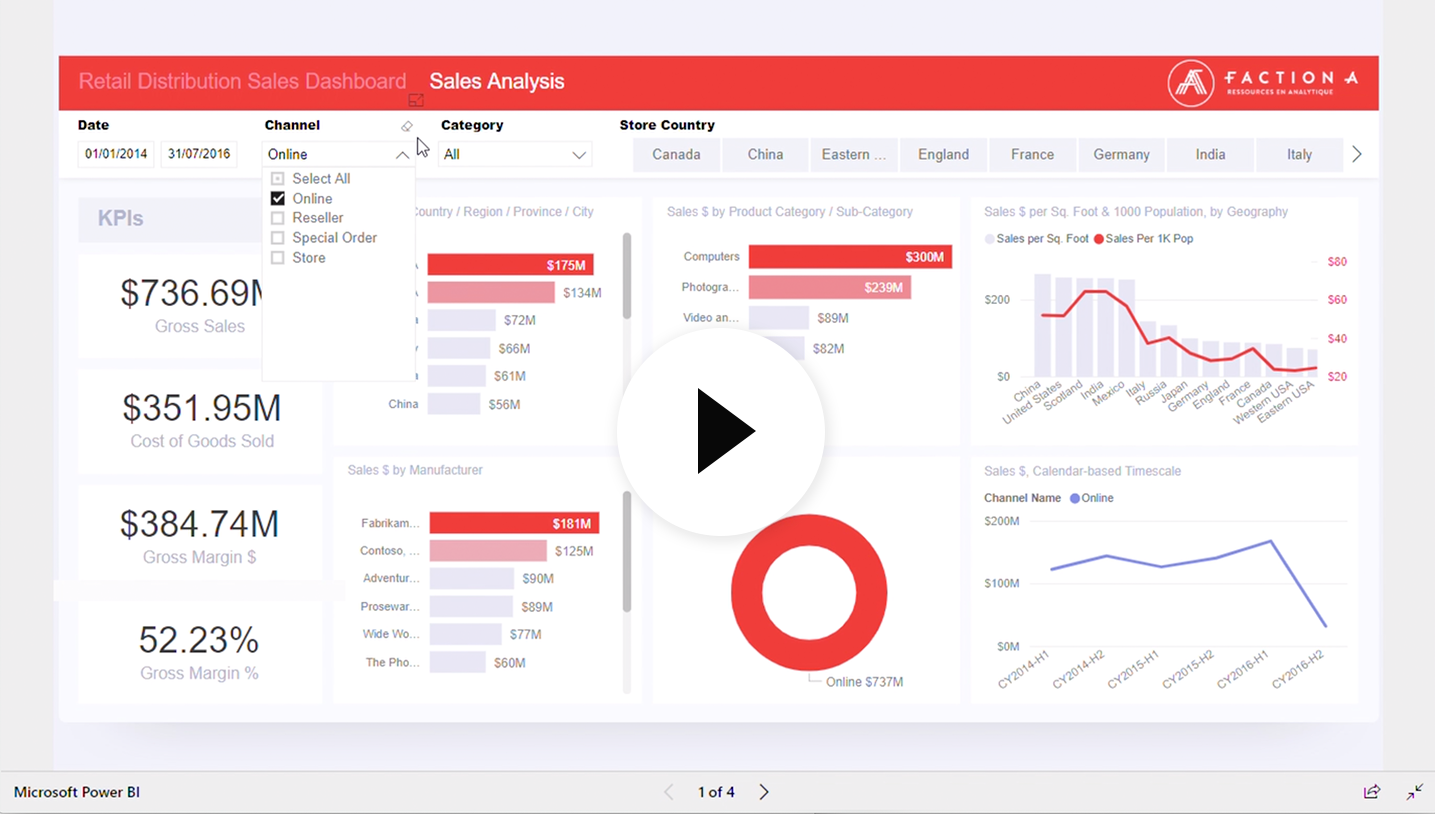
Here is a video of a dashboard created with Power BI.
Tools & Technologies
- Microsoft Power BI
- Local or In-the-Cloud Database
- Local Excel files or Office 365
- Microsoft Azure Services


