Solutions by Specialty
Finance Dashboards
Finance Dashboards
SECURED, AUTOMATED, VALIDATED
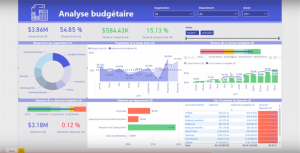
A financial dashboard allows you to track all your financial performance indicators in one place.
It enables financial departments to stay abreast of a company’s financial performance, manage cash flow effectively and track expenses, sales and profits in detail to achieve financial goals.
Unlike reports produced using Excel, financial dashboards created with Power BI allow:
- the publication of reports in a secure way;
- userd to extract information specific to their needs;
- easily integrate analytical applications to create interactive reports and visualisations.

The Great Avantages of Financial Dashboards
SECURITY
With Power BI, you control the broadcast of your reports. You can manage easily users and their access rights to information. Your users only have access to what you have determined. No Excel or PDF reports get shared with just anyone via email out of your control. All your data is centralized and can only be accessed by authorized users.
AUTOMATION
Automatic refresh of the contents of the reports. No need to constantly answer all the users’ specific questions. They can drill the data they need themselves. The propagation of information is done without human intervention. Monthly reports are automatically distributed to the right people.
VALIDITY
Power BI offers you automated data validation. Extraction, harmonization and data loading are automated. Changes to business rules are simple and are automatically updated for all dashboards and reports. A task impossible to accomplish with Excel without having to return the spreadsheets to all users. This is why several reports created with Excel contain incorrect formulas and have been circulating for several years!
Using Power BI Dashboards can help you manage all of your company’s financial categories:
- Accounts Receivable
- Profile Reports
- Expense Accounts – Error and Fraud Detection
- Financial Forecasting
- Income and Costs Forecasts
- Financial Management – number of days inventory pending, unmatured days
- Earnings and losses – gross results, operational results, net results
- Cash Flow – outstanding, outstanding sales
- Financial Performance – Return on Equity, Return on Assets, Debt Ratio, Working Capital Ratio
- Debt Modeling
- Wage Profiling
- Financial Structure – Business Acquisition
Other avantages of Power BI vs. Excel
- Data Segmentation, by user
- Automated extraction, harmonisation et loading
- Automatic refreh of reports content
- Automated Data Validation
- Simple end-user management and of their information access rights
- Information Propagation
- Without human intervention
- Great data analysis
Tools & Technologies
- Microsoft Power BI
- Local or Cloud-based Datawarehouse
- Local Excel files
- Microsoft Azure Services


